Scientific Graphs
|
Most scientific graphs are made as line graphs. There may be times when other types would be appropriate, but they are rare.
The lines on scientific graphs are usually drawn either straight or curved. These "smoothed" lines do not have to touch all the data points, but they should at least get close to most of them. They are called best-fit lines. In general, scientific graphs are not drawn in connect-the-dot fashon. |
source |
Exercises (Answers) questions>
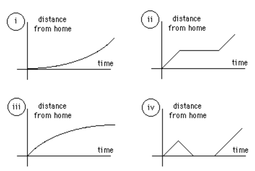
1st graph.
1.- It says that when he just left home when he realized he forgot his books. So its number 4 because the graph shows the line going up and then down, that means that the person come back to his house.
2.Things went fine until I had a flat tire. Its number 2 because it shows the line going away from the house and then it stopped and continued (the car had a flat tire)
3.-But sped up... Its number 3 because the line goes up slow, after the person realized he was going to be late the line starts to move more quick.
|
2nd graph.
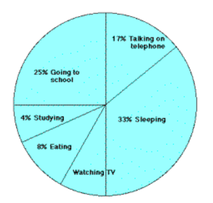
a. 13% because its a total of a 100%. If you add up everything and you subtract the result from 100, the result will be 13. b. 8 hours because the graph has a total of 24 hours. 17% is 4, 6+2 is the result. (see the graph at the right) c. Studying because its the activity with less %. d. Going to school because 25 is a quarter. e. Sleeping (17%) and talking to the telephone (33%), if you add them the result is 25%. f. Talking to the telephone (17%) and eating (8%), if you add them the result is 25% |
|
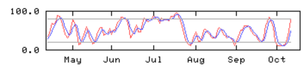
3rd graph.
a. 2 sets of data: the months and the numbers.
b. April because its the month before may.
c. Mid July, because its the highest part of the graph.
a. 2 sets of data: the months and the numbers.
b. April because its the month before may.
c. Mid July, because its the highest part of the graph.
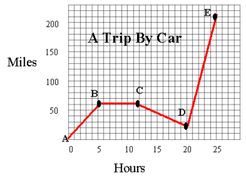
4th graph.
a. 270 miles because you add up the miles you traveled.
b. 10 miles per hour because of the time transcurred in miles during hour.
c. The car stopped and then it continued, because the line stopped for a while and after a few hours it continued.
d. 80 miles. Because thats what the car did during 5 hours.
e. 20 miles because it increases the speed.
f. line DF. Because it goes more that 50 miles in a little.
|
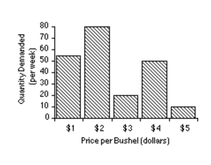
5th graph.
a. Quantity demanded because price per bushel is the independent variable so price per bushel changes to see the changes. b. No, sometimes it increases other times it decreases. c. 10 per week, that what the graph says. |
|
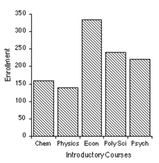
6th graph.
a. 1250, you add all the number of students.
b. 12% are majoring in physics.
c. 140 because thats what the graph says.
d. 20 aprox. You see the difference in the graph.
a. 1250, you add all the number of students.
b. 12% are majoring in physics.
c. 140 because thats what the graph says.
d. 20 aprox. You see the difference in the graph.
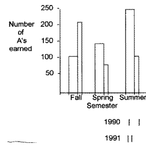
7th graph.
a. 250 You add the lines in the graph to see the result.
b. 180 aprox. again like before you add the 2 lines.
c.1990. If you add the numbers of A's, 1990 is more than 1991.
d. Summer because it has more A's than the other months.
e. 1991, spring semester. It started decreasing more than the other months.
|
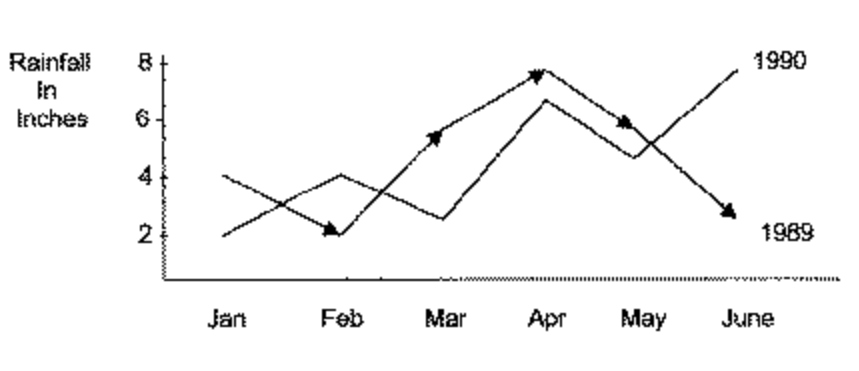
8th graph.
a. 3, see the lines that point on 3. b. 1 more inch. When you see the graph you clearly see the difference between the 2 years. c. 1989 because it had 7 years. d. April in both years it rained a lot. |
|
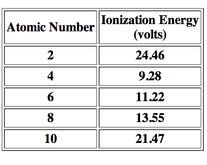
9th graph.
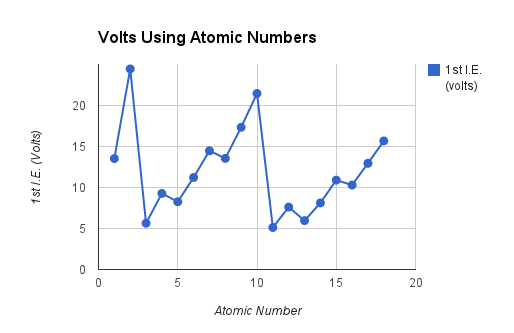
a. Atomic number, it changes to see the result of the volts.
b. Ionization energy, changes when de dependent variable changes.
c. 2, the graph shows them.
d. 10 its the higher energy.
e. A line graph.
a. Atomic number, it changes to see the result of the volts.
b. Ionization energy, changes when de dependent variable changes.
c. 2, the graph shows them.
d. 10 its the higher energy.
e. A line graph.
|
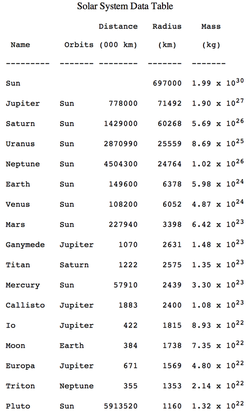
10th graph.
a. There are represented 8 planets without counting Pluto, There are 8 planest because the orbit of the planet is the sun. b. 7 moons. because the planet is their orbit. c. Io - Jupiter From all the moons the one that has more mass is Io. d. Venus because its the closest radius to the earth. e. 0 because pluto is a planetoid and its bigger. f. Io, the radius g. Venus is the closest planet to the earth, because of the distance to the sun and earth |
|
Graphing Problems>
Problem 1
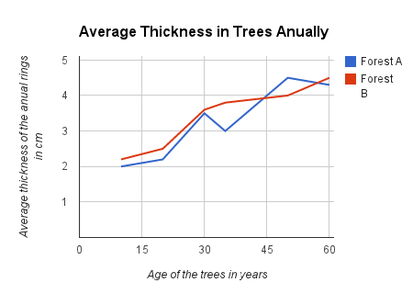
A. Make a line graph of the data.
B. What is the dependent variable?
- Average thickness of the anual rings in cm
C. What is the independent variable?
- Age of the trees in years.
D. What was the average thickness of the annual rings of 40 year old trees in Forest A?
- 3.5 aprox.
E. Based on this data, what can you conclude about Forest A and Forest B?
- Both trees grow similar over the years.
Problem 2
A. Make a line graph of the data.
B. What is the dependent variable?
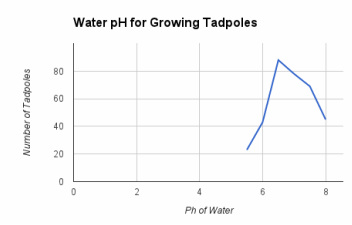
- Number of Tadpoles.
C. What is the independent variable?
- pH of Water.
D. What is the average pH in this experiment?
- 6 to 7 aprox.
E. What is the average number of tadpoles per sample?
- 60.
F. What is the optimum water pH for tadpole development?
- 6.5.
G. Between what two pH readings is there the greatest change in tadpole number? - 6 to 6.5.
H. How many tadpoles would you expect to find in water with a pH reading of 5.0
- 15 to 18.
B. What is the dependent variable?
- Number of Tadpoles.
C. What is the independent variable?
- pH of Water.
D. What is the average pH in this experiment?
- 6 to 7 aprox.
E. What is the average number of tadpoles per sample?
- 60.
F. What is the optimum water pH for tadpole development?
- 6.5.
G. Between what two pH readings is there the greatest change in tadpole number? - 6 to 6.5.
H. How many tadpoles would you expect to find in water with a pH reading of 5.0
- 15 to 18.
Problem 3
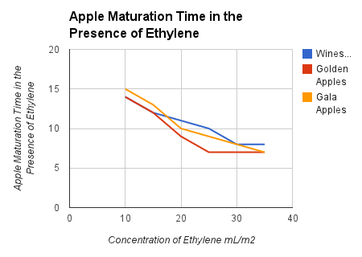
A. Make a line graph of the data.
B. What is the dependent variable?
- Apple Maturation Time
C. What is the independent variable?
- Concentration of Ethylene
B. What is the dependent variable?
- Apple Maturation Time
C. What is the independent variable?
- Concentration of Ethylene
Extra Credit Problems
Problem 4
Problem 5
|
|
Problem 6
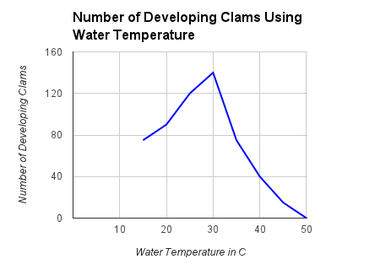
- A clam farmer has been keeping records concerning the water temperature and the number of clams developing from fertilized eggs. The data is recorded above.
- Make a line graph of the data.
- What is the dependent variable? - Number of developing Clams.
- Water Temperature in C
5. What is the optimum temperature for clam development?
- 30 C.
Problem 7
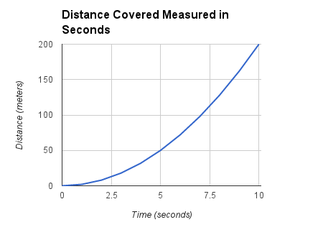
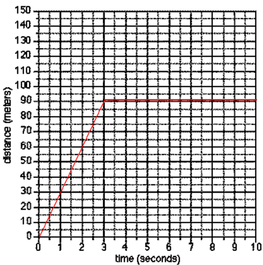
Problem A
- Graph the data.
- What does this graph represent?
Problem B
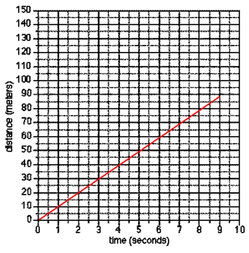
A. What type of motion does this graph represent?
-Forward constant velocity.
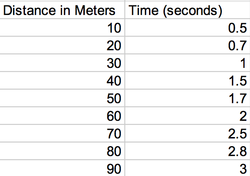
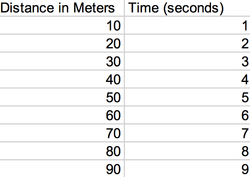
B. Put the data from this graph into a table.
-Forward constant velocity.
B. Put the data from this graph into a table.
Problem C